Building a Browser History Tracker
An End-to-End Data Engineering Project for Beginners


Making a project in data engineering is something that I always struggle about. Most of the time, I don't know where to start and I end up not making anything.
After searching for different inspirations to start a project, I've stumbled upon the idea of "why not track my history since I am always surfing the web". I got interested on where I spend most of my time on the internet and which time of the day I always surf. And now, I have made this project.
On this blog, I will share to you everything about the project including: python scripts, workflows, and everything that I've used.
Tools
Python
Python is the core tool in this project. I ALMOST used it for everything including: making an ETL pipeline, code profiling, and style checking.
Google Sheets and Microsoft Excel
These two spreadsheets will serve as the local and cloud storage. I know that it's not a good idea but I think it's a good start to have a good understanding of ETL processes and storing data.
Microsoft Power Automate
This one will handle the automation of the process, from downloading my history to displaying it on a data visualization tool. This does not need much knowledge, a YouTube video helped on my simple processes.
Looker Studio
This is the data visualization tool that I've used. I'm not a fan of Looker because I think it still lacks some features compared to other Data Viz or BI tools. I'm more of an MS Power BI guy, but I tried this one to learn a new tool and also because it is the same cloud platform as Google Sheets.
History Export Extension
I like this extension. This one eased up the extraction of my browser history. I just need to download this extension and export my data. The extension can be downloaded here.
Python Libraries
pandas and numpy
These two, well, they don't do much but they played a great role for structuring the data after preprocessing them.
gspread and oauth2client
These are the needed libraries in order to transfer data from Python to Google Sheets. These will need a little configuration because you I to enable Google APIs and downloading a json, which will be shown later.
logging
This library helped me in knowing which part of the workflow is already executed or on which part of the program is the source of the error, I will show later!
pycodestyle
Well, this one is for readability. As a programmer, it is important to have a convention in writing programs like "when to put a space in an operation" or "how many space to put in a comment".
line_profiler
This library helped me to know which part of my program runs the longest and may be subject for improvement.
Well, that's pretty much it to the tools and libraries that I've used!
File Structure
To get a glimpse of my project, this is my file structure:
Browser History-
├── data/
|   ├── preprocessed/
|   |   ├── browser_history_local_data.csv
|   |   L── z_{latest_timestamp}.csv
|   |
|   ├── raw/
|   |   ├── latest_timestamp.txt
|   |   L── z_{latest_timesstamp}.txt
|
├── scripts/
|   ├── etl/
|   |   L── etl.py
|   |
|   ├── qa/
|   |   ├── profile_reader.py
|   |   L── style_checker.py
|   |
|   L── main.py
|
L── README.md
You may notice that I have files called z_{latest_timesstamp}.txt and z_{latest_timestamp}.csv. Well, these files will be named based on the latest timestamp given by my history.
Workflows
Of course, a file structure is not enough, I need a flow in order to know what will happen and to not get lost easily. I have two workflows: the ETL pipeline and the automation workflow.
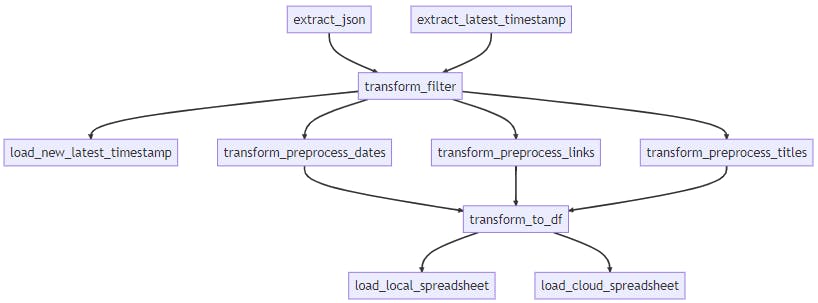
ETL Pipeline
This one is "quiet" simple. Everything that starts with "extract" is the extract part of the ETL, the same goes for "transform" and "load".
Automation Workflow
I mentioned earlier that I'd used MS Power Automate, right? The workflow here is what will be followed using it.
Doing the Project
Now that the file structure and flowcharts are designed, it's time to actually start the project. First one is downloading the extension.
History Export
You can download the extension on this link: History export. You should see something like this if you followed:
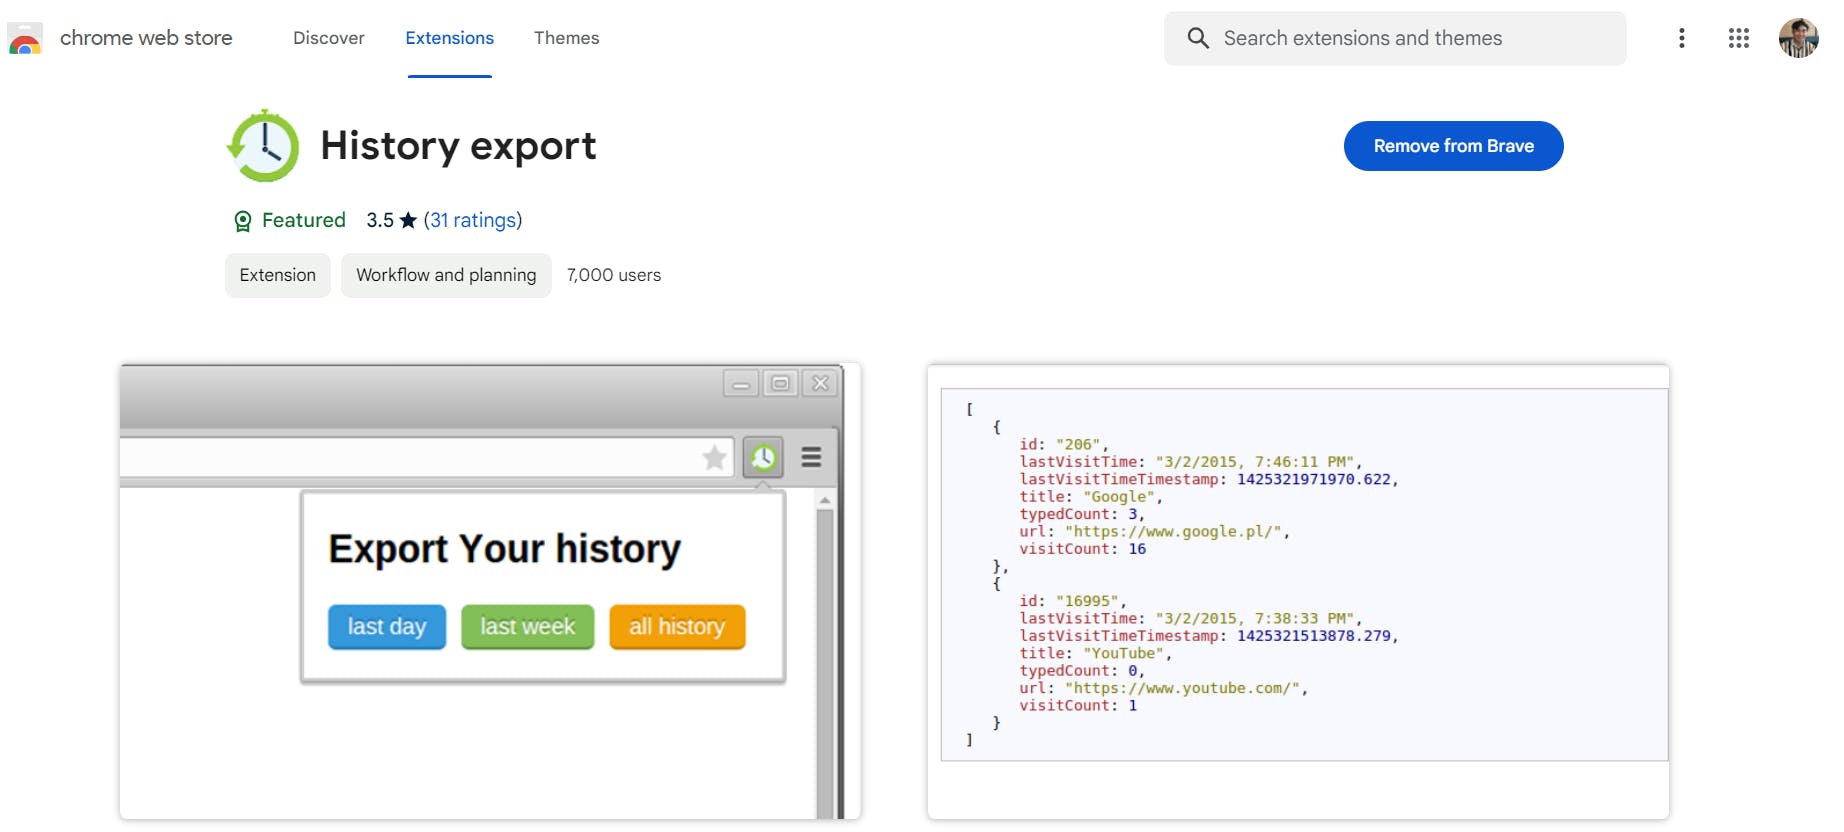
I am using Brave browser, so as you can see it shows "Remove from Brave". It should display "Add to Brave" but I have already downloaded it. In your case, it depends on your browser. If you're using Google then you should see "Add to Google".
On this extension, the "last week" option is the one that I am always using to export my browser history.
Python Scripts
Note that I will NOT post all of my scripts here because they are way too long. Instead, I will put the scripts and some of the things that I think are worth mentioning.
Before I share my Python scripts for this project, I want to let you know how I make my functions in Python.
Consider this as my convention or standards in writing Python functions. Note that this only applies to scripts that are directly related to the ETL pipeline workflow.
Here is an example:
import logging
logging.basicConfig(format='%(levelname)s: %(message)s', level=logging.DEBUG)


def add(number_1, number_2):
    '''
    Add two numbers and return them as float
    ----
    Parameters
    number_1: int/float - the first number
    number_2: int/float - the second number
    ----
    Return
    result: float - the sum of the first and second number in float type
    ----
    Example
    >>> add(4, 5)
    9.0
    '''
    try:
        result = float(number_1 + number_2)
    except Exception as e:  # Catch all kind of errors
        logging.error(f"{e} caught in execution.")
    else:
        logging.info(f"Added {number_1} and {number_2} = {result}")
        return result
Now, I'll explain each part.
import logging
logging.basicConfig(format='%(levelname)s: %(message)s', level=logging.DEBUG)


def add(number_1, number_2):
The libraries will be imported at the very top and some of its configurations. Additionally, you can see that there are two line space in between the imports and the function. This came from the standards of the style checker in Python.
def add(number_1, number_2):
    '''
    Add two numbers and return them as float
    ----
    Parameters
    number_1: int/float - the first number
    number_2: int/float - the second number
    ----
    Return
    result: float - the sum of the first and second number in float type
    ----
    Example
    >>> add(4, 5)
    9.0
    '''
Docstring. As you can see, it consists of four parts: explanation, parameters, output, and an example.
Having a docstring for each function helps me to understand what each code does, expected input, and supposed output, especially after being gone for a long time and I need to look at my code again.
    try:
        result = float(number_1 + number_2)
    except Exception as e:  # Catch all kind of errors
        logging.error(f"{e} caught in execution.")
    else:
        logging.info(f"Added {number_1} and {number_2} = {result}")
        return result
This part covers all the logic of the function and it is divided into three parts: trying an operation or logic (try), handling the result of the logic if an error occurs (except), and handling the result of the logic if no error occurs (else). Also you can see logging.error and logging.info in there which helps me to see on the terminal which part of the function is executed.
This method helps my functions to be debugged easily, I learned this on DataCamp!
Okay, done with my convention. Time for the real code!
etl.py
Okay, this one is reaaaaaally long so I'll just put the link here. This program follows the ETL pipeline workflow so if you visit the link, you'll see that it follows my convention.
Here is an example helper function from the Python script:
def helper_lls(file):
    '''
    Check if the "browser_history_local_data.csv" exists inside
    the directory.
    ----
    Parameters
    file: str - the file to check
    ----
    Return
    :bool
    '''
    try:
        is_file_exist = os.path.exists(file)
    except Exception as e:
        error(f'{e} caught in execution. F: helper_lls')
    else:
        info('File found.')
        return is_file_exist
That's just one function, and I consider it very long so I cannot post everything here to not bore you. But I have one function that I think is worth spending time on. You can also see it on the link but I will share it here also.
def load_cloud_spreadsheet(df):
    '''
    Load the DataFrame into Google Sheets.
    ----
    Parameters
    df: DataFrame - the DataFrame to be loaded
    ----
    Return
    None
    '''
    try:
        scope = [
                "https://spreadsheets.google.com/feeds",
                "https://www.googleapis.com/auth/spreadsheets",
                "https://www.googleapis.com/auth/drive.file",
                "https://www.googleapis.com/auth/drive"]
        json = 'path_to_google_credential.json' #  Change this one
        creds = ServiceAccountCredentials.from_json_keyfile_name(json, scope)
        client = gspread.authorize(creds)
        spreadsheet = client.open("name_of_spreadsheet") #  Change this one
        worksheet = spreadsheet.worksheet("name_of_sheet") #  Change this one
        info(f"Total iterates: {len(df['Date']) // 50 + 1}")
        info(f"Total links: {len(df['Date'])}")
        for row in range(len(df['Date'])):
            #  Send 50 data at max to avoid reaching the limit per minute.
            if row % 50 == 0:
                info("Sleep for 1 minute")
                time.sleep(60)
                info(f"Iterate {row + 1}")
            data = [str(df['Date'][row]),
                    str(df['Time'][row]),
                    str(df['Website'][row]),
                    str(df['Title'][row])]
            worksheet.append_row(data)
    except Exception as e:
        error(f'{e} caught in execution. F: load_cloud_spreadsheet')
    else:
        info('Loaded to cloud spreadsheet.')
The load_cloud_spreadsheet function. As you can read from the docstring, this function aims to load the DataFrame into Google Sheets but I have learned a few things about Google Sheets by making this.
Before making this function, I need to enable some Google APIs first in the Google Developers Console and this article from GeeksForGeeks really helped me to set things up.
After setting things up, you can base on my code on things to change.
json = 'path_to_google_credential.json', as you can read, this should be the file path to your json file that contains ALL your Google credentials for your project. You can find the needed credential at the bottom part of the json.
spreadsheet = client.open("name_of_spreadsheet"), this should contain the name of your spreadsheet. Mine is "Browser Activity Online" so it should be spreadsheet = client.open("Browser Activity Online") .
worksheet = spreadsheet.worksheet("name_of_sheet"), this should be the name of the worksheet. My worksheet's name that contains the data is "data" so it is worksheet = spreadsheet.worksheet("data") .
Also, you may notice this part of the code:
        for row in range(len(df['Date'])):
            #  Send 50 data at max to avoid reaching the limit per minute.
            if row % 50 == 0:
                info("Sleep for 1 minute")
                time.sleep(60)
I have read from Google API Docs that Google Sheets is limited to 50 write/read requests per minute. That's why after sending 50 records of data to Google Sheets, I delayed the programmed for a minute.
main.py
This Python script is where all of the functions from the etl.py will be run.
from etl.etl import *

import line_profiler

profile = line_profiler.LineProfiler()


@profile
def main():
    old_latest_ts = extract_latest_timestamp()

    jfile = extract_json()

    dates = transform_filter(jfile, latest_timestamp=old_latest_ts)[0]
    preprocessed_date = transform_preprocess_dates(dates)
    dates_ = preprocessed_date[0]
    times = preprocessed_date[1]

    new_latest_timestamp = transform_filter(jfile,
                                            latest_timestamp=old_latest_ts)[1]
    load_new_latest_timestamp(file='..\\data\\raw\\latest_timestamp.txt',
                              new_time=new_latest_timestamp)

    links = transform_filter(jfile, latest_timestamp=old_latest_ts)[2]

    websites = transform_preprocess_links(links)

    titles = transform_filter(jfile, latest_timestamp=old_latest_ts)[3]

    all_titles = transform_preprocess_titles(titles)

    df = transform_to_df(dates_, times, websites, all_titles)

    load_local_spreadsheet(df, extract_latest_timestamp())
    load_cloud_spreadsheet(df)

    transform_change_data_name(old_file='..\\data\\raw\\history.json',
                               name=extract_latest_timestamp())


if __name__ == "__main__":
    main()
    profile.print_stats()
Uhm, that's quiet long for this post my bad. You don't have to look at the main function but it runs all the ETL processes based on the ETL pipeline workflow.
One thing that I want you to notice is the line_profiler, @profile , and the profile.print_stats() . All of these are needed in order to profile the code (code profiling).
Code profiling, based on my limited knowledge, is a process on knowing the performance of your program. Like knowing which part of your code runs the longest and needs to be optimized.
This is a sample output from the main function after running on the command line.
Timer unit: 1e-07 s

Total time: 165.476 s
File: C:..\Browser-Activity-Data\scripts\main.py
Function: main at line 9

Line #      Hits         Time  Per Hit   % Time  Line Contents
==============================================================
     9                                           @profile
    10                                           def main():
    11         1      41060.0  41060.0      0.0      old_latest_ts = extract_latest_timestamp()
    12
    13         1     133680.0 133680.0      0.0      jfile = extract_json()
    14
    15         1       6743.0   6743.0      0.0      dates = transform_filter(jfile, latest_timestamp=old_latest_ts)[0]
    16         1      41652.0  41652.0      0.0      preprocessed_date = transform_preprocess_dates(dates)
    17         1          5.0      5.0      0.0      dates_ = preprocessed_date[0]
    18         1          3.0      3.0      0.0      times = preprocessed_date[1]
    19
    20         3       6701.0   2233.7      0.0      new_latest_timestamp = transform_filter(jfile,
    21         2          5.0      2.5      0.0                                              latest_timestamp=old_latest_ts)[1]
    22         2       5754.0   2877.0      0.0      load_new_latest_timestamp(file='..\\data\\raw\\latest_timestamp.txt',
    23         1          2.0      2.0      0.0                                new_time=new_latest_timestamp)
    24
    25         1       6676.0   6676.0      0.0      links = transform_filter(jfile, latest_timestamp=old_latest_ts)[2]
    26
    27         1      71423.0  71423.0      0.0      websites = transform_preprocess_links(links)
    28
    29         1       6620.0   6620.0      0.0      titles = transform_filter(jfile, latest_timestamp=old_latest_ts)[3]
    30
    31         1       5079.0   5079.0      0.0      all_titles = transform_preprocess_titles(titles)
    32
    33         1      17201.0  17201.0      0.0      df = transform_to_df(dates_, times, websites, all_titles)
    34
    35         1     100623.0 100623.0      0.0      load_local_spreadsheet(df, extract_latest_timestamp())
    36         1 1654199536.0    2e+09    100.0      load_cloud_spreadsheet(df)
    37
    38         2      18320.0   9160.0      0.0      transform_change_data_name(old_file='..\\data\\raw\\history.json',
    39         1      96355.0  96355.0      0.0                                 name=extract_latest_timestamp())
It is shown on line 36, which is the load_cloud_spreadsheet function, that it takes the most time when running. Highly understandable because I putted delays on that function so that I won't consume the per minute rate of Google API.
profile_reader.py
from datetime import datetime
import os

def get_datetime():
    return datetime.now().strftime("%m_%d_%Y %H_%M_%S")

def change_profile_name():
    try:
        old_name = 'profile_output.txt'
        datetime_ = get_datetime()
        new_name = f'z_{datetime_}.txt'
        os.rename(old_name, new_name)
    except:
        old_name = 'qa\\profile_output.txt'
        datetime_ = get_datetime()
        new_name = f'qa\\z_{datetime_}.txt'
        os.rename(old_name, new_name)

if __name__ == "__main__":
    change_profile_name()
What this code does is it changes the file name of the result of the profiled code, so that I can store another code profile on the next run without erasing the former.
style_checker.py
import pycodestyle

def style_check():
    style_checker = pycodestyle.StyleGuide()

    result = style_checker.check_files(['..\etl\etl.py', '..\main.py'])

    result.messages

if __name__ == "__main__":
    style_check()
As I mentioned earlier, style checking can help improve readability. This code will provide suggestions on how to improve the readability of the etl.py and main.py scripts based on PEP 8 standards. The results.messages displays the suggestions on the terminal.
Dashboard
Now that the data is available on locally and on Google Sheets, time to make a dashboard using Looker.
I will be using Google Sheets as the data source instead of Excel so that I won't need to upload the file every time that I refresh the data.
Questions
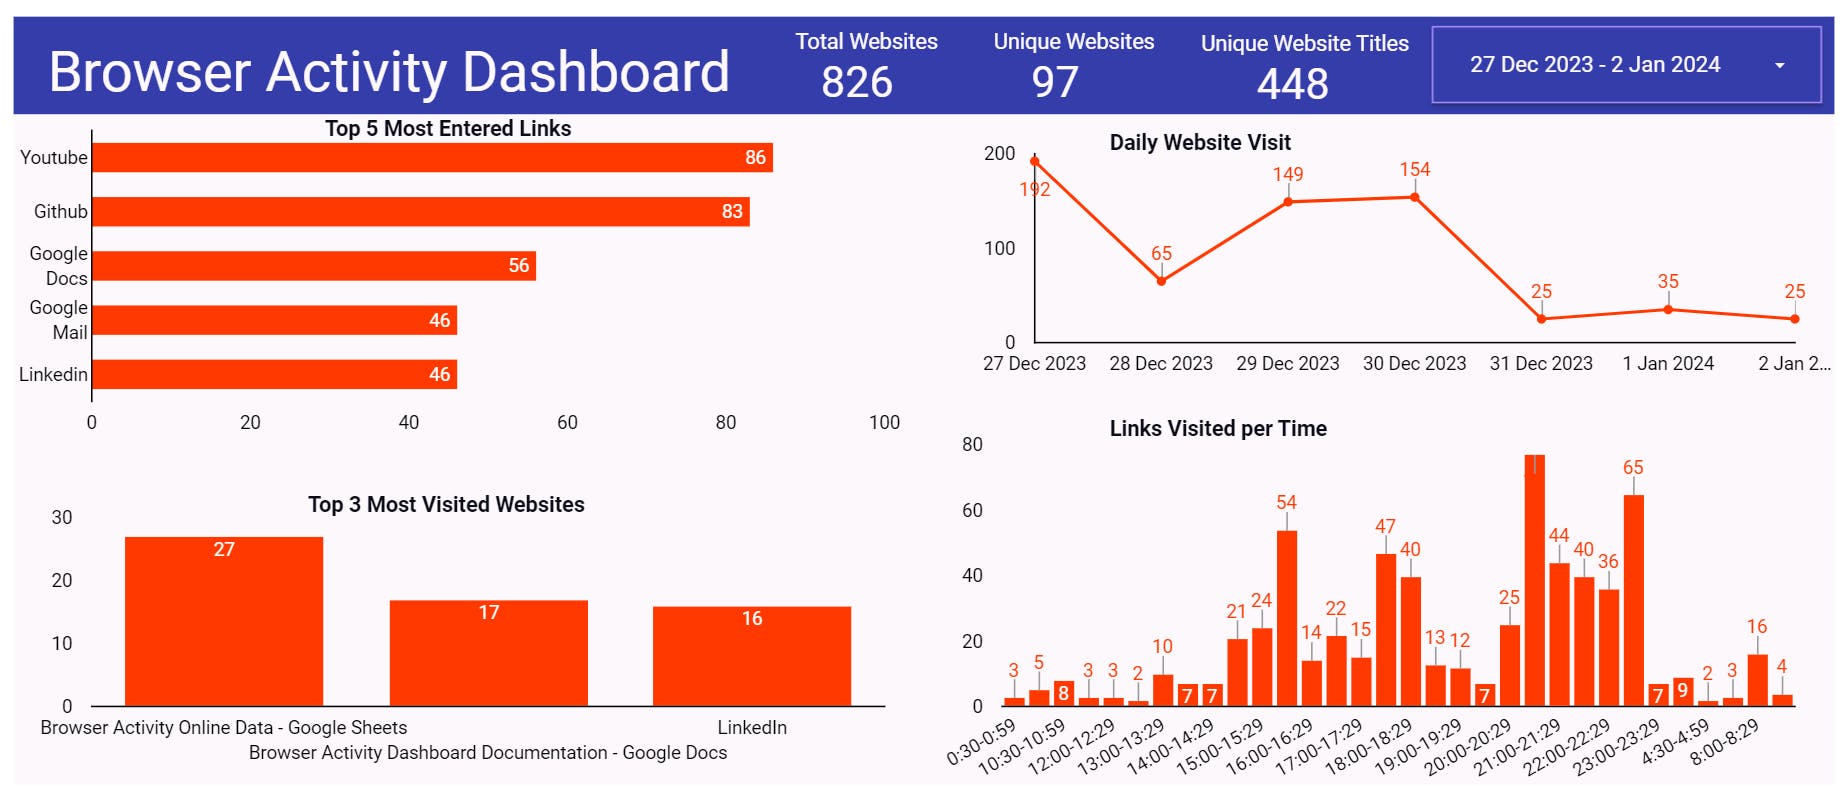
Before making the dashboard, what do I want to know? What questions would the dashboard answer? I have a few:
Which websites do I visit the most?
At what time of the day am I most active on surfing the web?
That's pretty much it actually. And based on this questions, I have made this dashboard:
Documentation
Documenting a dashboard is important so that other people who want to contribute on my project or just some people that wants to know more about the dashboard can have more idea behind the scenes.
It contains a short description or introduction about the dashboard, some terminologies, the setup, explanation of charts, metrics, and filters, and future possible improvements.
You can see my documentation here and the source of my content.
Automation
The thing is, this project has some steps that is repeatedly tiresome for me just to gather, preprocess, and display the data. That's why I decided to use MS Power Automate so that I can do all the things needed in just one click.
Manual Process
Before automating a process, first I need to understand my manual process.
I extract my browser history using the extension then save it on my local storage.
Run the
main.pyscript.Run the
profile_reader.pyscript.
That's it! The next step is to use MS Power Automate.
Automated Process
These are the screenshots of the automated process in MS Power Automate that follows my automation workflow:
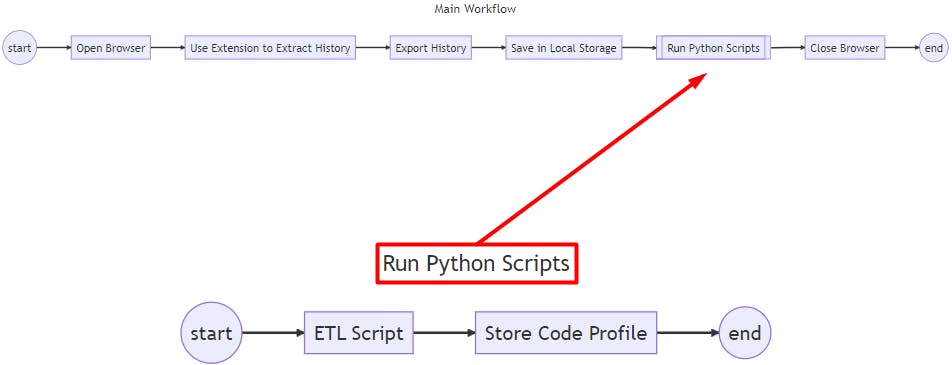
Main Workflow
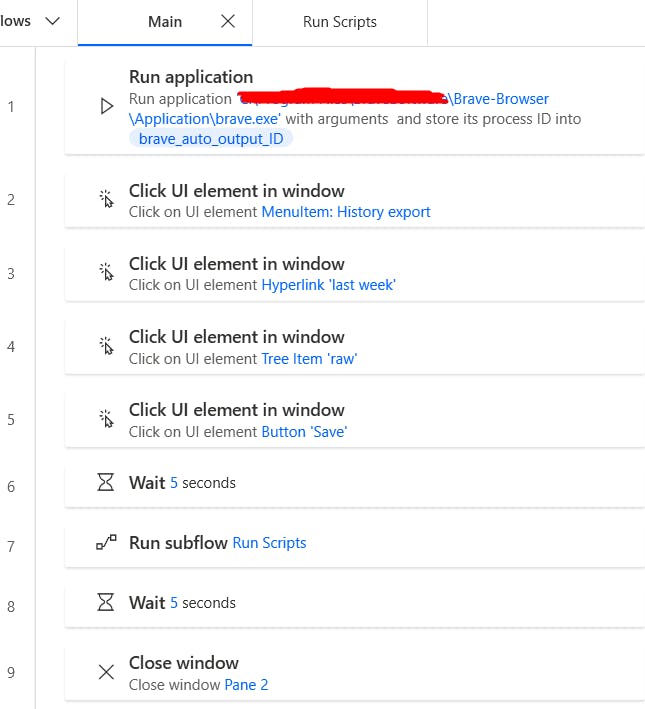
The is the main workflow in automation. There are 5 different processes: Run application, Click UI element int window, Wait, Run subflow, Close window.
Run application: What this does is open an application from my desktop. Basically, this will open my Brave browser.
Click UI element in window: This one will imitate my clicks. The first one imitates my click on opening the extension. Then clicking a button called "last week" to extract all of my history a week ago. Then going to my folder called "raw" and then saving it.
Wait: It's already in the name. I provided a 5 second window in order to have a smoother transition to the subflow.
Run subflow: This one will run my selected subflow, which is running Python scripts.
Close window: Since I opened my Brave browser, I have to close it to not clutter my screen.
Sub flow - Run Python Scripts
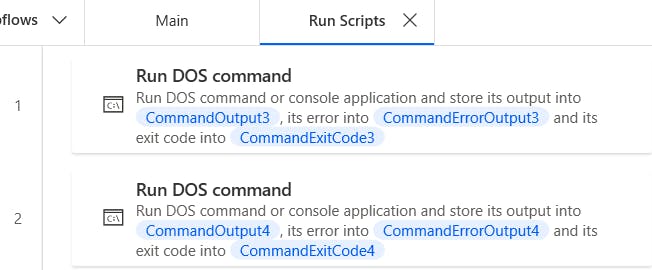
This is the subflow that will run when called by the main flow. The Runs DOS command will run a command using the command line.
The first process will run the command:
pymain.py> qa\profile_output.py.The second one will run:
py qa\profile_reader.py.
That's all for the automation part!
Closing Remarks
Data engineering is an interesting field for me that's why I wanted to kickstart my learning through making a project that is closely related to me. In this project, I (maybe also you) learned about how to utilize Python for making an ETL pipeline, connect a dashboard to a data source, and to automate processes.